AI Incident After-Action Library
Twelve structured after-action reviews of public AI safety incidents, written in the format an operational incident-response function actually uses — plus the code that validates them and computes what twelve reviews say together that no single review says alone.
Why this exists
I spent my career in policing and public-sector operations, where a serious incident produces a written review that a stranger can read and act on. That discipline is what AI safety and trust & safety teams are now building internally, and it is largely invisible from outside.
This is me doing that work in the open, weekly, on real incidents. It is not a survey of the field and it is not commentary. It is twelve worked examples of the artefact those teams produce, plus the tooling to keep them honest as the collection grows — one new review a week, or a written record of why none qualified.
The finding that organises the rest
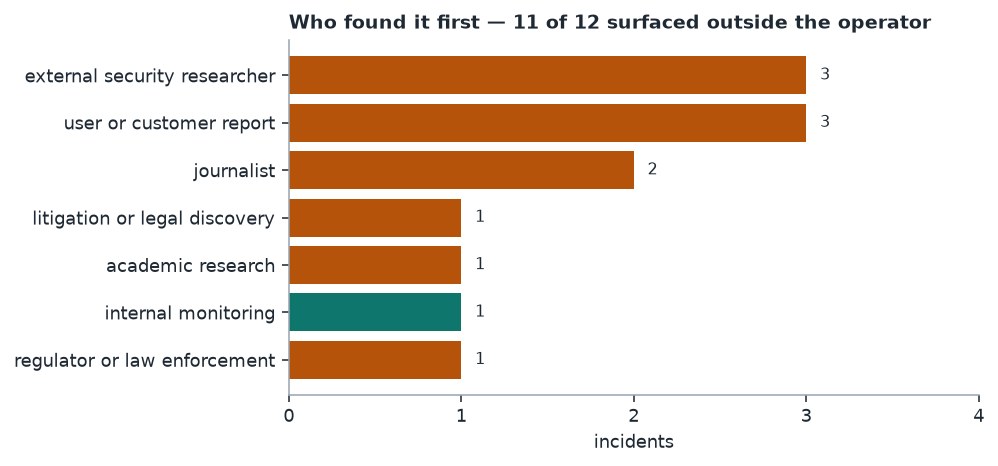
In 11 of 12 incidents (92%), the failure was first surfaced by someone outside the organisation that built or ran the system — a security researcher, a journalist, a customer, a regulator, or a court filing. The operator's own monitoring or red-teaming found 1 of 12.
Every organisation in this library has an evaluation function, a safety team and a security programme. The gap is not that these failures were undetectable; several were found within hours by an outsider who went looking.
The gap is that nobody inside was looking in that particular place, and in most cases the reason is structural rather than negligent: the monitoring was aimed at the system's intended use, and the failure occurred in its actual use.
Time
| Interval | What it measures | Across the library |
|---|---|---|
| Onset → detection | Monitoring coverage | median 2 days (range 0–47, known for 8 of 12) |
| Detection → disclosure | Disclosure posture | median 0 days (range 0–73, known for 9 of 12) |
| Detection → mitigation | Playbook quality | median 2 days (range 0–44, known for 9 of 12) |
The two intervals are within a day of each other, so neither dominates. What separates them is the tail: the slowest detection ran to 47 days, and in every incident here the organisation had the technical means to fix the problem throughout the period it did not know about it.
The expensive interval is the one before anyone knows, and it is the one nobody is paid to shorten.
What actually broke
Across 12 incidents the reviews record 19 distinct failure mechanisms, a mean of 3.0 per incident. The most frequent were excessive agency (4), inadequate age assurance (4), unsafe model behaviour (3), fabricated output (3) and policy design failure (3).
The recurring shape is not a model producing a bad sentence. It is a capable system placed in a context where the surrounding controls assumed a narrower blast radius than the system actually had.
Which controls failed
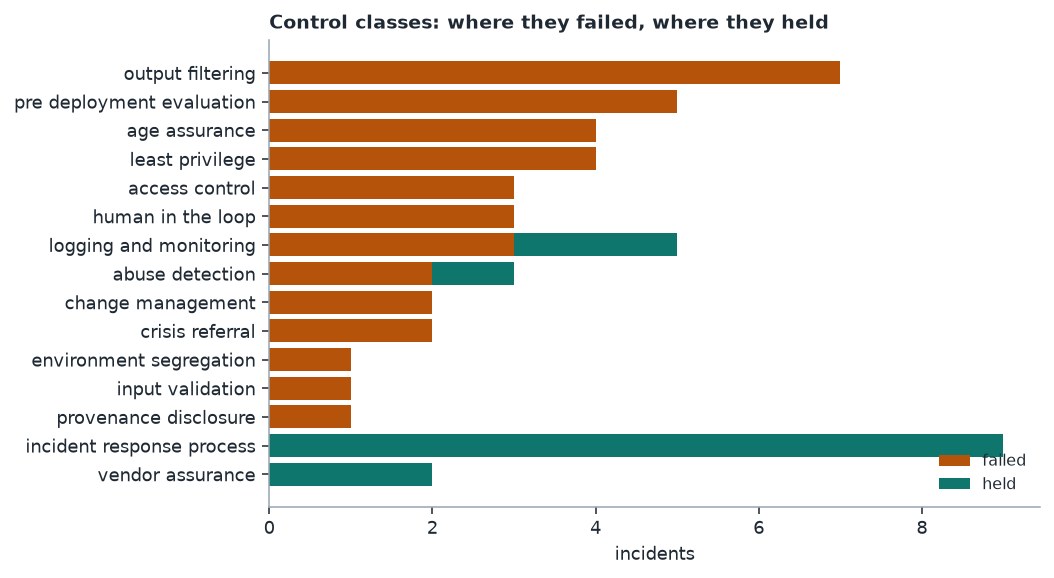
| Control | Failed in | Held in | Failure rate |
|---|---|---|---|
| Output filtering | 7 | 0 | 100% |
| Pre-deployment evaluation | 5 | 0 | 100% |
| Age assurance | 4 | 0 | 100% |
| Least privilege | 4 | 0 | 100% |
| Access control | 3 | 0 | 100% |
Read the held column alongside the failed column. Controls that never appear as holding are usually not weak controls — they are controls that were never built, being named after the fact as though they had been.
Corrective actions
The library records 66 corrective actions, 5.5 per incident. 33 of them (50%) are externally verifiable — a person outside the organisation could confirm whether the change was actually made. The remainder are commitments to unobservable internal change.
They may well have happened. The point is that no outside party, including a regulator, can tell.
By type: code (21), documentation (15), process (10), configuration (8), monitoring (4), governance (4).
How it's kept honest
- Every figure in the reports is computed from the structured front matter of the review files. None is typed by hand.
- Schema validation on every review; the build fails if a review is malformed.
- Documented sourcing standards distinguishing primary from secondary sources — 15 of 51 sources are primary.
- Where an interval is unknown, the denominator says so rather than quietly dropping the case.
Next project
Turning a written usage policy into something you can measure — and finding that leakage beat over-refusal by 1.8×, inverting the framing the project was built around.
Policy-to-Eval Harness